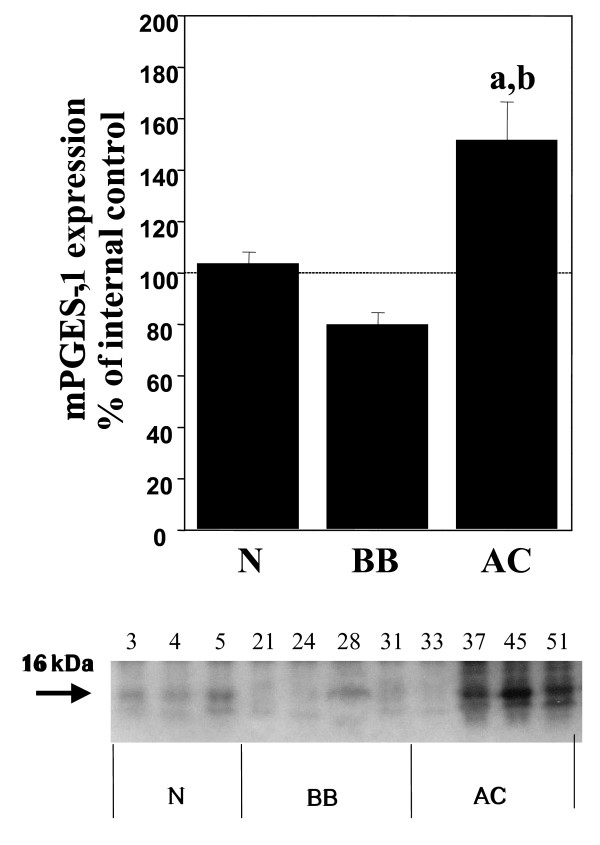
Figure 3.
Relative protein expressions (mean ± SEM) of mPGES-1in normal ovaries (N = pre- and postmenopausal ovaries (n = 10), BB = benign- and borderline type tumours, (n = 13), and AC = adenocarcinomas (n = 22).(a) P < 0.05 vs normal samples (N), (b) P < 0.05 vs benign/borderline (BB). The measurements are presented as percentage changes compared to a reference sample (normal ovarian tissue). Below each histogram a representative immunoblott is presented. Each number correlates to the patho-histological description of the sample (see Table 1).

