FIG. 9.
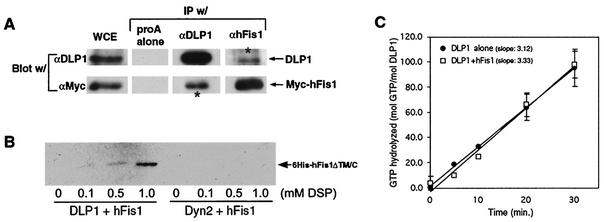
hFis1 and DLP1 interact with each other. (A) BHK-21 cells were transfected with Myc-hFis1 and cross-linked by DSP. The cell lysate (whole-cell extract [WCE]) was subjected to immunoprecipitation (IP) by anti-DLP1 (αDLP1) or anti-hFis1 antibodies. Immunoprecipitated proteins were analyzed by immunoblotting with anti-DLP1 and anti-Myc antibodies. Immune complexes isolated by DLP1 or hFis1 antibodies contained Myc-hFis1 or DLP1, respectively (asterisks), indicating that the two proteins were in the same complex. (B) Purified recombinant His6-tagged hFis1ΔTM/C was incubated with either DLP1 or conventional dynamin (Dyn2) in the presence of increasing concentrations of the cross-linker DSP. DLP1 or Dyn2 was isolated by immunoprecipitation with anti-DLP1 or antidynamin antibodies, respectively. Coimmunoprecipitation of hFis1 was assessed with anti-His antibodies. His6-hFis1ΔTM/C was detected in the DLP1 immunoprecipitate in the presence of DSP, showing the most in 1.0 mM DSP. No hFis1 was present in the dynamin immunoprecipitate even in 1.0 mM DSP. (C) The GTPase activity of DLP1 was assayed by thin-layer chromatography. Hydrolyzed GTP was calculated by the ratios between GDP and total nucleotide (GTP plus GDP) and plotted for reaction periods. The rate of GTP hydrolysis is expressed as the slope of average trendlines in the graph. DLP1 alone has a rate of 3.1 mol of GTP/min/mol of DLP1, and addition of equal moles of purified hFis1 to DLP1 did not significantly affect the GTPase activity of DLP1, showing 3.3 mol of GTP/min/mol of DLP1. Error bars indicate standard deviations.

