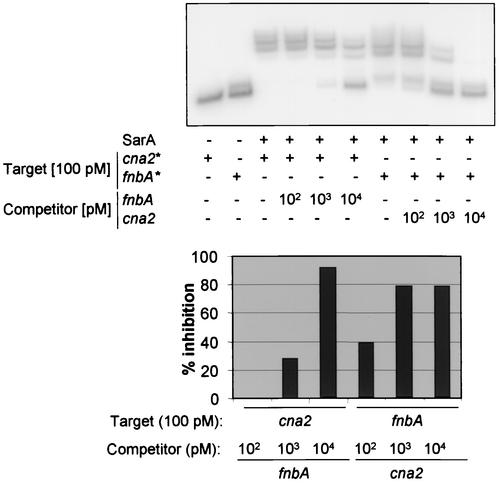
FIG. 3.
Competitive EMSA. (Top) A 100 pM concentration of the labeled target DNA was mixed with 1,500 pM SarA in the presence of increasing amounts of unlabeled competitor. Bound and unbound DNAs were subsequently resolved by native PAGE. (Bottom) Percent inhibition based on phosphorimaging analysis of the gel shown in the top panel.

