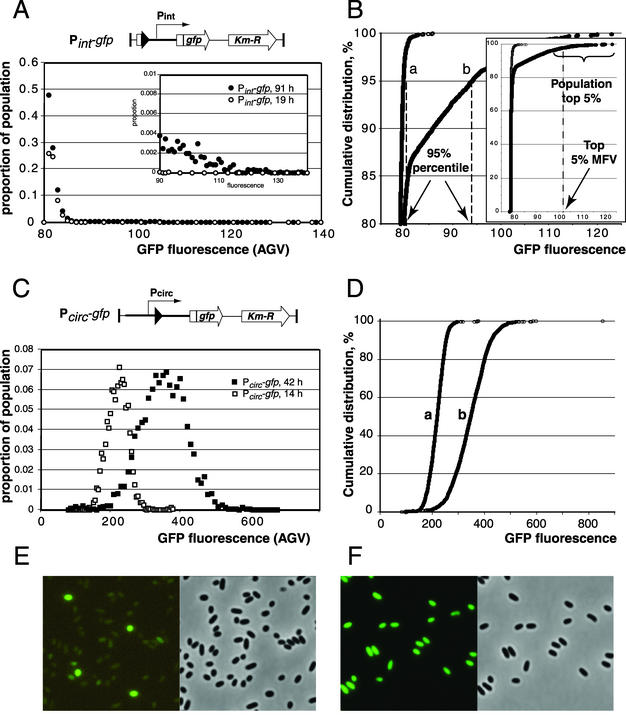
FIG. 2.
Distribution of GFP fluorescence intensities in cells of Pseudomonas sp. strain B13 (Pint-gfp) and B13 (Pcirc-gfp) taken at different stages of growth. (A and C) Untransformed distribution curves for the GFP fluorescence levels (expressed as AGV units per cell, calculated with Metaview) among individual cells of a population of Pseudomonas sp. strain B13 (Pint-gfp) and B13 (Pcirc-gfp), respectively. Each data point is the relative proportion of the population carrying fluorescence values in that particular range (i.e., bin size; for panel A, 1 fluorescence unit; for panel C, 5 and 10 units for the data series at 14 and 42 h, respectively). (B and D) Cumulative distribution plots from the data shown in A and C, respectively, in order to visualize the concepts of 95th percentile and top 5% mean fluorescence value (MFV). A fluorescence value of 79 corresponds to dark (nonfluorescent) cells and is an arbitrary value produced by the image recording system. Each data point represents the fluorescence value of a single cell. The inset in B shows the range of fluorescence values for the whole population, whereas the main panel focuses on the range above 80%. Note the strong aberration of the single-cell fluorescence distribution in populations of B13 (Pint-gfp) from the normal distribution as for strain B13 (Pcirc-gfp); see C and D. Cells of strain B13 (Pint-gfp) were grown in batch cultures with 10 mM CBA as the C source. Samples were taken at 19 h (exponential growth phase, curve a) and 91 h (stationary phase, curve b). Cells of Pseudomonas sp. strain B13 (Pcirc-gfp) were grown in batch cultures with 10 mM CBA as the C source, and samples were taken at 14 h (curve a, exponential growth phase) and 42 h (curve b, stationary phase). Note the different scales of fluorescence in panels A and B versus C and D. (E and F) Micrographs of typical population differences of strain B13 (Pint-gfp) and strain B13 (Pcirc-gfp), respectively, taken in stationary phase under GFP illumination (left) and the corresponding image in phase contrast (right). The fluorescence image in panel E was electronically enhanced to the same light intensity as that in panel F.

