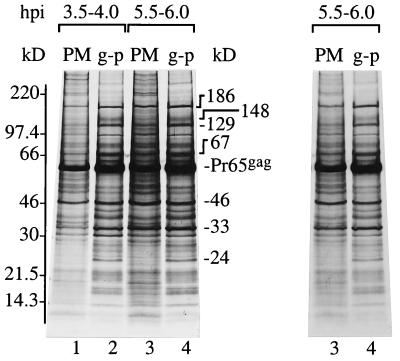
Figure 6.
Sorting of host proteins during budding of Gag particles. 35S-labeled Gag particles (g-p) and PMs were adjusted to contain an equal amount of membranes and then analyzed by SDS/PAGE. Samples in lanes 1 and 2 are from a particle production between 3.5 and 4.0 h after infection and those in lanes 3 and 4 are from a production between 5.5 and 6.0 h after infection. Host proteins in Gag particles are indicated. (Right) A shorter exposure of the gel analysis of the samples from the later collection period.

