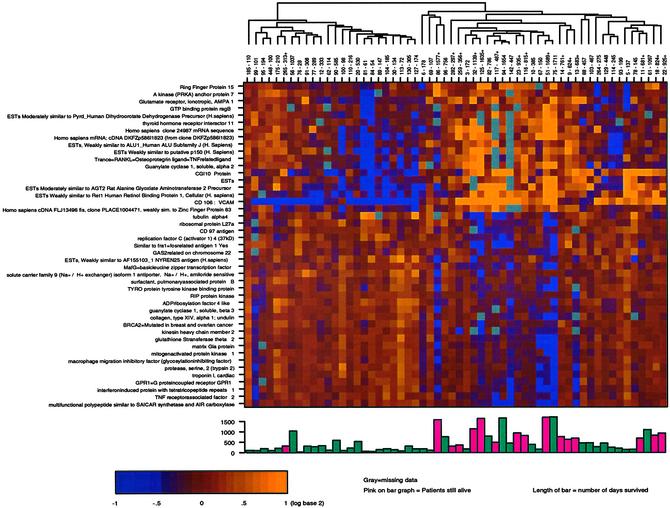
Fig. 2.
Cluster matrix of 45 genes most significantly associated with survival. The colors in the matrix represent a maximum of 2-fold up-regulation (brightest yellow) or 2-fold down-regulation (brightest blue) relative to the median for each gene. The patients (columns) are labeled by patient number followed by the number of days alive after nephrectomy. The bar graph below the matrix graphically depicts the length of patient survival; red bars represent patients who are still alive. The dendrogram above the patient list graphically depicts the two major patient groups and minor subgroups within the two larger groups.

