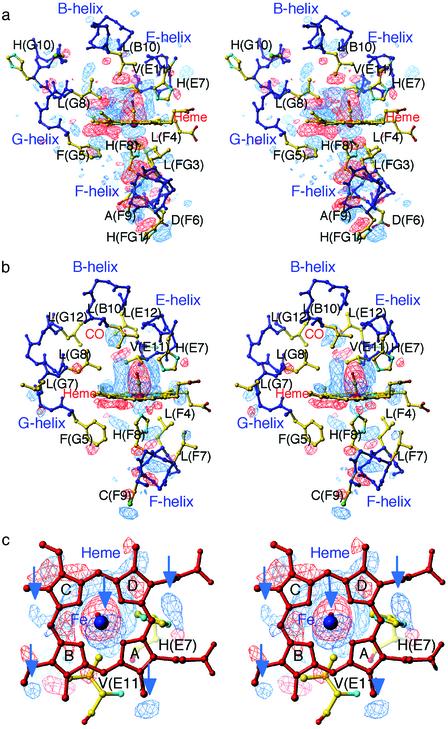
Fig. 2.
Stereoview of difference Fourier maps of the active-site structures between T-state photoproducts and CO-bound structures contoured at ±3σ.(a) The α1 heme region in XL[α(Fe-CO)β(Ni)]2 (molecule 1) at 25 K. (b) The β2 heme region in XL[α(Ni)β(Fe-CO)]2 (molecule 2) at 25 K. (c) The β2 heme region in XL[α(Ni)β(Fe-CO)]2 (molecule 2) at 25 K viewed along the β iron-proximal His(F8) bond. Arrows pointing to the positive densities at the iron and the rim of the heme indicate the direction of the sliding motion of the β heme. In this and all subsequent difference maps, negative and positive density are shown in red and blue, respectively.

