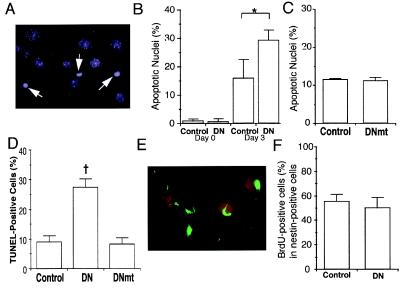
Figure 4.
Effects of inhibition of MEF2 function during neuronal differentiation of P19 cells. Control cultures (clone 2–1), MEF2 dominant negative cultures (clone 2–7, labeled DN), and mutated MEF2 dominant negative cultures (clone 2–16, labeled DNmt) were treated with retinoic acid for 3 days. (A) Representative apoptotic cells with condensed nuclei from a MEF2 dominant negative clone treated with retinoic acid and stained with Hoechst dye to detect apoptotic morphology (white arrows). (B) Percentage of apoptotic cells in control or MEF2 dominant negative cultures before and after retinoic acid treatment. (C) Similar percentage of apoptotic cells in control or mutated MEF2 dominant negative cultures after 3 days of retinoic acid. (D) Apoptosis in control, dominant negative, or mutated dominant negative cultures treated with retinoic acid for 3 days scored by the TUNEL technique. (E and F) Lack of effect of MEF2 dominant negative on multipotent precursor cell proliferation. Control cultures and MEF2 dominant negative cultures were treated with retinoic acid for 3 days. BrdUrd then was added to visualize proliferating cells. (E) Dividing multipotent precursor cells detected by double staining with anti-BrdUrd antibody (red) and anti-nestin antibody (green) in retinoic acid-treated control cells. (F) Comparison of BrdUrd incorporation into multipotent (nestin-positive) precursor cells in control and MEF2 dominant negative cultures. Values are mean ± SD from at least three independent experiments (*, P < 0.05 by Student's t test; †, P < 0.001 by ANOVA and post hoc comparison).

