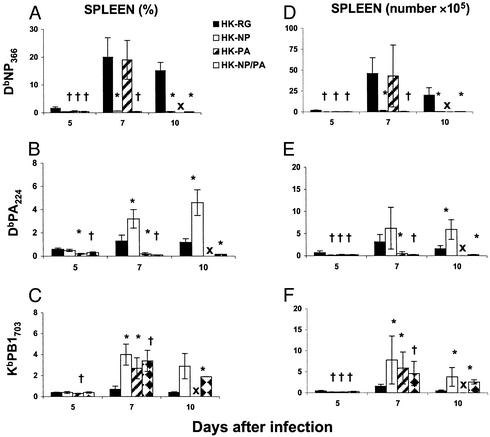
Fig. 3.
Mice primed i.p. 8 weeks previously with 108 eID50 of the PR-RG and mutant viruses were challenged i.n. with 106.3 eID50 of the homologous HK variants. At various time points after infection, the splenic CD8+ T cell response was measured by staining with the DbNP366 (A and D), DbPA224 (B and E), and KbPB1703 (C and F) tetramers. The results are expressed as the percentage of cells staining (A–C) and the numbers of epitope-specific cells (D–F) that were calculated from the percentage values and the total cell counts (data not shown). The results are expressed as mean ± SD, and significant differences from the HK-RG are shown as * (P < 0.05) and † (P < 0.01). X denotes 100% death.

