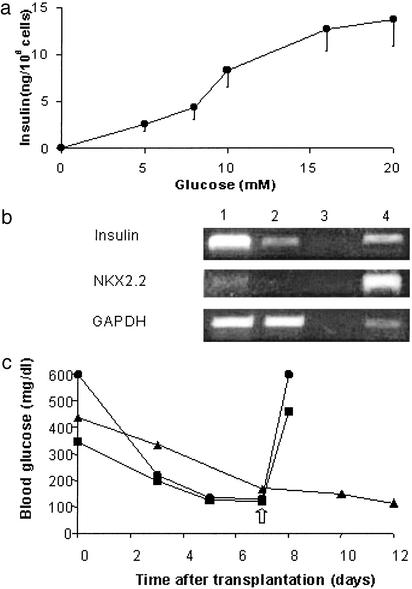
Fig. 6.
Characterization of FH-B-TPN cells after a 6-day incubation in serum-free medium. (a) Glucose-induced insulin secretion during a 30-min incubation. Values are mean ± SEM of three replicate wells. (b) Expression of transcripts of pancreatic genes analyzed by RT-PCR. 1, serum-free medium; 2, regular medium; 3, mix; 4, human islets. (c) Cell transplantation under the renal capsule of NOD-scid STZ-induced diabetic mice. Each line represents fed blood glucose levels of a single mouse. The arrow marks left-kidney nephrectomy of the mice labeled by circles and squares, leading to hyperglycemia.

