Fig. 1.
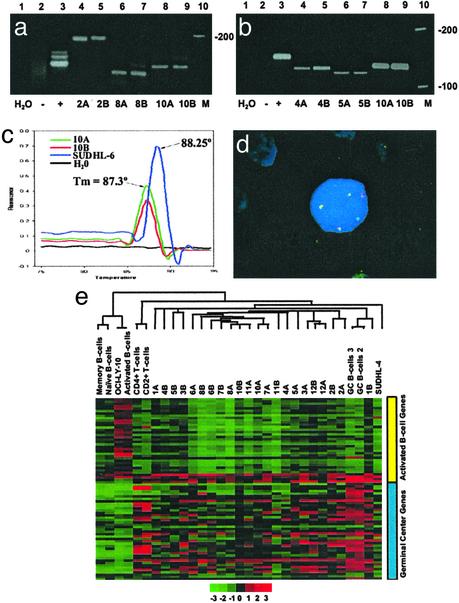
(a– d) Clonal relationship between matched pairs of FL and DLBCL. (a) IgH PCR. Lane 1, H2O control; lane 2, polyclonal control (reactive tonsil); lane 3, monoclonal control from the Raji cell line; lanes 4 and 5, monoclonal bands of identical size in the FL (2A) and the subsequent DLBCL (2B); lanes 6 and 7, monoclonal bands of identical size in the FL (8A) and DLBCL (8B) from patient 8; lanes 8 and 9, monoclonal bands of identical size in the FL (10A) and DLBCL (10B) from patient 10; and lane 10, DNA ladder. (b) bcl-2/JH (major breakpoint region, MBR) translocation. Lane 1, H2O control; lane 2, negative control (reactive tonsil); lane 3, positive control (SUDHL-6 cell line); lanes 4 and 5, bcl-2/JH products of identical size in a FL (4A) and the subsequent DLBCL (4B); lanes 6 and 7, identical bcl-2/JH product sizes in the FL and DLBCL from patient 5; lanes 8 and 9, identical bcl-2/JH product sizes in the FL (10A) and DLBCL (10B) obtained from patient 10; and lane 10, DNA ladder. (c) bcl-2(MBR)/JH product detection by fluorescence melting peak analysis. The peak at melting temperature 88.25°C represents the bcl-2/JH product from the positive control (SUDHL-6). bcl-2/JH products with a distinct melting peak with melting temperature 87.3°C is observed for both the FL (10A) and DLBCL (10B) samples from patient 10. No peak is observable in the negative control (reactive tonsil) or the H2O control. (d) t(14;18) Fluorescent in situ hybridization. One bcl-2 (green), one IgH (red), and three bcl-2/IgH (yellow) fusion signals are present. Two of the bcl-2/IgH fusion signals (yellow) represent the derivative chromosomes resulting from the reciprocal translocation. The third yellow signal represents duplication of the derivative chromosome. This fluorescent in situ hybridization pattern was detected in both the FL and DLBCL samples from patient 6. (e) Hierarchical clustering of FL and transformed FL. A total of 76 genes distinguishing GCB from the ABC-like profiles were selected from our 6,912-gene array. Clustering was performed with cluster and visualized by using tree view. Each row represents a gene and each column represents a sample. Red represents higher relative expression of a particular gene and green represents lower relative expression. The color scale at the bottom varies from -3 to +3 in log base 2 units. Consistent with their origin from GCB, the FLs and their corresponding DLBCLs exhibit a GCB-like profile.

