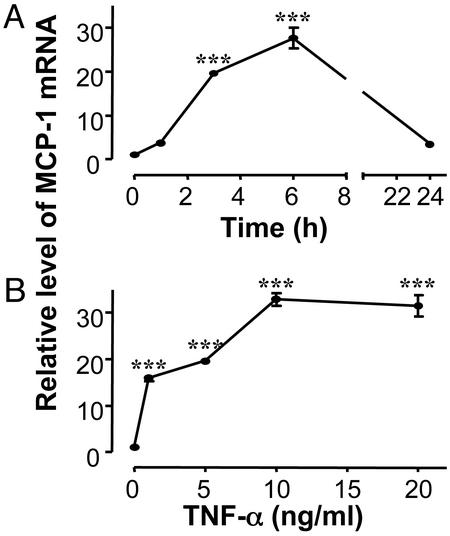
Fig. 2.
Effect of TNF-α on MCP-1 gene expression in vitro. Differentiated normal 3T3-L1 adipocytes were cultured as described in Methods, and then incubated in the presence or absence of 5 ng/ml TNF-α for different times (A) or incubated for 3 h with different concentrations of TNF-α (B). MCP-1 gene expression was analyzed by using real-time RT-PCR and normalized to expression of 18S rRNA. The data are expressed as relative mRNA level compared with the average expression in cells incubated without TNF-α (=1). The error bars represent the SE (n = 3); ***, P < 0.001 relative to cells incubated without TNF-α.

