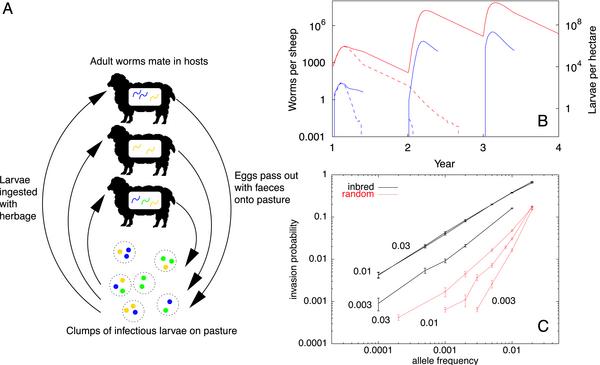
Fig. 3.
Sheep–trichostrongylid model. (A) Schematic diagram. (B) Worms per host (in blue) and larvae per hectare (in red) for two typical realizations, one corresponding to extinction (dotted lines) and one to an epidemic (solid lines). (C) Invasion probability both with (inbred) and without (random) spatial inbreeding, for different values of the clumping parameter; the error bars are standard errors from the simulations (based on >10,000 realizations).

