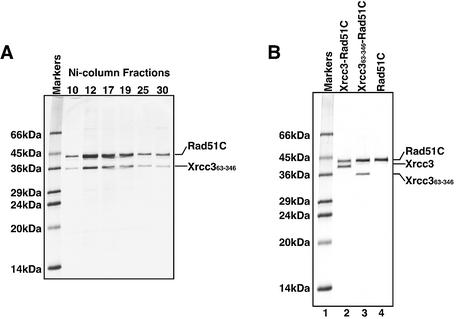
Figure 2.
Purification of the Xrcc363–346–Rad51C complex. (A) SDS–PAGE (15–25% gradient) of the Ni-column fractions of Xrcc363–346–Rad51C. Fractions (10 µl) containing Xrcc363–346–Rad51C were analyzed. Fraction numbers are indicated at the top of the gel. Bands were visualized by Coomassie brilliant blue staining. (B) SDS–PAGE (15–25% gradient) of the purified Xrcc3–Rad51C, Xrcc363–346–Rad51C and Rad51C proteins. Lane 1 is molecular weight markers. Lanes 2–4 indicate Xrcc3–Rad51C (0.5 µg), Xrcc363–346–Rad51C (0.5 µg) and Rad51C (0.5 µg), respectively. The proteins were visualized by Coomassie brilliant blue staining.

