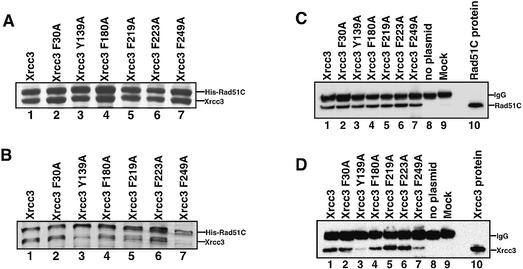
Figure 6.
Biochemical analyses of the Xrcc3–Rad51C interaction. (A) SDS–PAGE (15–25% gradient) of cell-free extracts from cells that co-expressed His6-tagged Rad51C and FLAG-tagged Xrcc3 (or the FLAG-tagged Xrcc3 point mutants). The cell-free extracts (3 μl of supernatant) were subjected to SDS–PAGE (15–25% gradient). Bands were visualized by Coomassie brilliant blue staining. Lane 1 indicates the positive control with the wild-type Xrcc3 protein. Lanes 2–7 indicate the experiments with the Xrcc3 point mutants, F30A, Y139A, F180A, F219A, F223A and F249A, respectively. (B) Protein fractions bound to the ProBond resin were analyzed by SDS–PAGE (15–25% gradient). Bands were visualized by Coomassie brilliant blue staining. Lane 1 indicates the positive control with the wild-type Xrcc3 protein. Lanes 2–7 indicate the experiments with the Xrcc3 point mutants, F30A, Y139A, F180A, F219A, F223A and F249A, respectively. (C and D) Immuno-precipitation analysis with the anti-Rad51C antibody. Protein fractions precipitated with the anti-Rad51C antibody-conjugated rProtein A Sepharose were detected by the anti-Rad51C antibody (C) and by the anti-Xrcc3 antibody (D). Lane 1 indicates the positive control with the wild-type Xrcc3 protein. Lanes 8 and 9 indicate the negative controls without the co-expression plasmid for Xrcc3–Rad51C and with rProtein A Sepharose treated with non-immune serum, respectively. Lanes 2–7 indicate the experiments with the Xrcc3 point mutants, F30A, Y139A, F180A, F219A, F223A and F249A, respectively. Purified Rad51C and Xrcc3 were applied as markers [lane 10 of (C) and lane 10 of (D), respectively].

