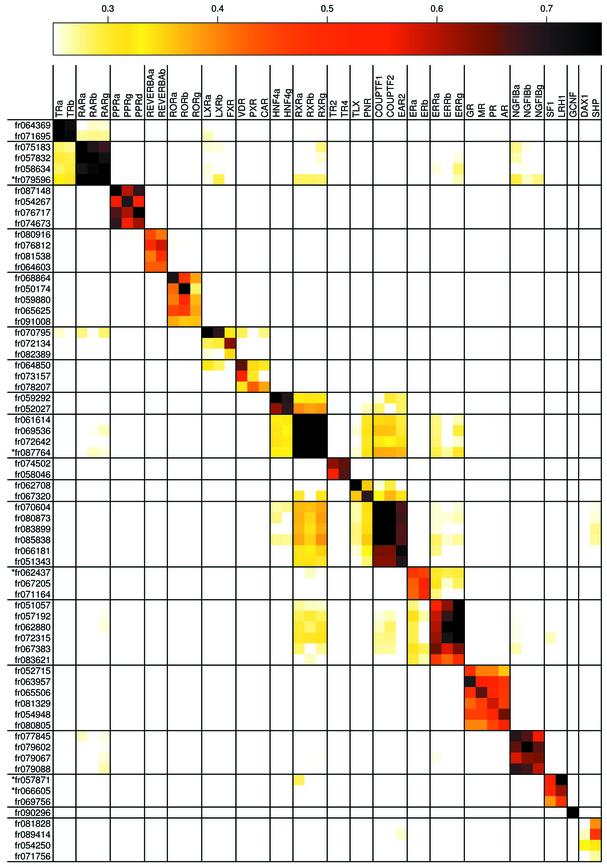
Figure 2.
(Opposite) Sequence comparison. The percent identity of each Fugu LBD sequence was compared to the complete set of human NR LBDs. Percent identities are indicated by color, with white indicating <25% identity, black indicating ≥75% identity and intermediate percent identities indicated as in the legend above the table. The human NRs are listed in order of their subfamily numbers and the Fugu sequences are ordered according to their closest human ortholog. Sequences that resulted from combining two separate Fugu sequence identifiers are marked with an asterisk.

