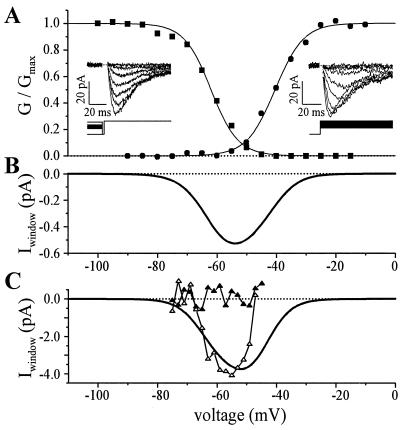
Figure 5.
Whole-cell properties of the T-type Ca2+ current. Ca2+ (1.8 mM) was used as a charge carrier. (A) Fusion-competent myoblast. Circles represent the normalized activation conductance curve (holding potential between steps was −100 mV) and squares the normalized inactivation conductance curve (steady holding potential between steps lasted 10 s). Conductances were normalized to the maximum conductance and were fitted with a Boltzmann equation. (Left Inset) Current traces from steady-state inactivation voltage protocol (test potential was to −30 mV). (Right Inset) Current traces during depolarizing steps. Leak current was obtained by adding 1 mM Cd2+, and was subtracted. (B) Predicted T-window current, same cell as in A. The predicted T-window current was obtained by multiplying the predicted T-window conductance by the driving force on calcium ions. Predicted T-window conductance was calculated by multiplying the activation conductance curve (not normalized) by the normalized inactivation conductance curve. (C) T-window current recorded in a small myotube. The voltage protocol to obtain the continuous line representing the computed window current was the same as in B. Open triangles represent the inward Ca2+ current directly measured when the cell was held steadily for 3 s at potentials between −45 mV and −75 mV (steps of −2 mV). Ca2+ currents were measured at the end of the 3-s holding potentials to ensure that T-channels were at steady-state. Leak current was estimated by linear extrapolation of the current record at potential between −69 and −75 mV, and was subtracted. Closed triangles represent the currents evaluated during the same voltage protocol but after addition of 1 mM Cd2. The difference between computed and directly measured window current at potentials more depolarized than −50 mV could be explained by a residual activation of Ca2+-dependent outward currents.

