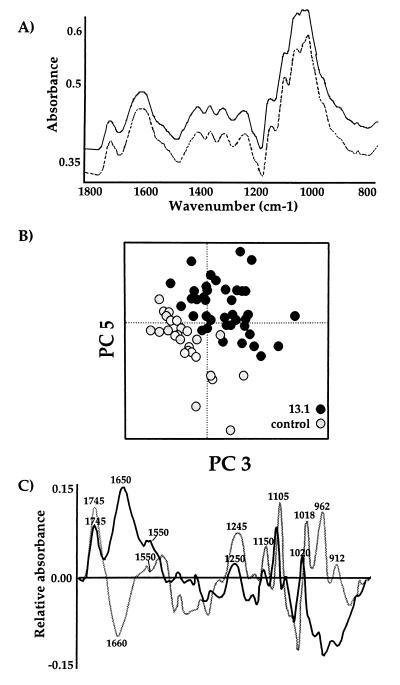
Figure 1.
(A) Averaged FTIR spectra of potato tuber cortex from 20 wild-type tubers (solid line) and 20 T13.1 tubers (dashed line). (B) Exploratory PC analysis discriminates T13.1 from the wild type, using the third and fifth PC scores. (C) The loadings for PC3 (black line) and PC5 (gray line) show features characteristic of pectins at 1,745, 1,250, 1,150, 1,105, and 1,018 cm−1.

