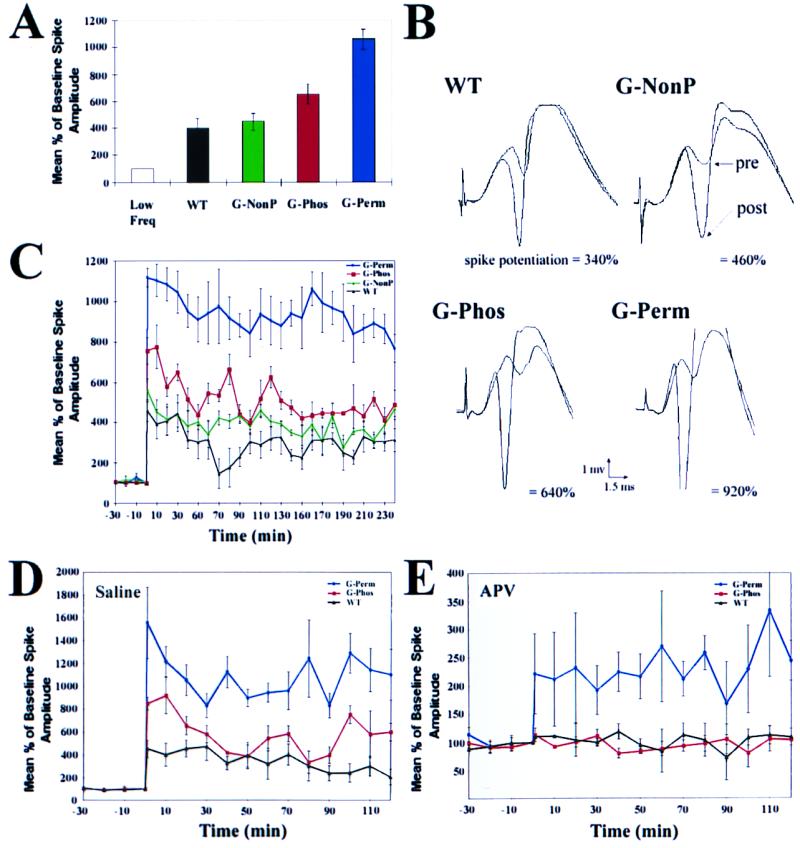
Figure 2.

As compared with WT controls, overexpression of GAP-43 of either the G-Phos or G-Perm type led to an immediate and persistent enhancement of conventional LTP. In contrast, overexpression of G-NonP, the nonphosphorylatable GAP-43, did not enhance LTP beyond that seen in WT mice. (A) Comparison of low frequency (low freq) controls receiving an 0.1 Hz stimulus, with transgenic and WT mice receiving a high frequency tetanus. There was no difference in response to low frequency stimulation over the 4-h test period among the four mouse groups. Mean percentage increase relative to baseline before tetanus in population spike (±SEM) recorded from the granule cell layer of the dentate gyrus at 30 min was similar for WT and G-NonP animals but was enhanced by the G-Phos and G-Perm transgene. The latter two groups demonstrated significantly greater LTP than WT and G-NonP (P < 0.05 for G-Phos vs. WT and vs. G-NonP; P < 0.001 for G-Perm vs. WT and G-NonP; P < 0.02 for G-perm vs. G-Phos (ANOVA followed by t tests of individual comparisons). n = 4 per group. (B) Average of five consecutive waveforms taken from each of the four mouse strains before, and 1 h after, perforant path tetanus. Note that, before tetanus, waveform shape and amplitude are similar for the four lines. After tetanus, a dramatic enhancement was observed in the population spike (below each waveform is the percentage enhancement for that particular set of waveforms). (C) Kinetics of enhanced LTP over 4-h period. Note the persistence of enhanced LTP in G-Perm animals, and its decline in G-Phos mice, approaching the level of enhancement seen in WT and G-NonP animals. (D and E) Effect of NMDA receptor antagonist 2-amino-5-phosphonovaleric acid (APV) on G-Perm, G-Phos, and WT animals. Whereas LTP is blocked by APV in G-Phos (red line) and WT (black line) controls as expected, LTP is still present in G-Perm animals (blue line) after APV treatment. In D, note that the amplitude and kinetics of enhanced LTP essentially replicate the results in uninjected animals (C), even with injection of 21 nl injection of vehicle into the molecular layer 15 min before tetanus (n = 3 per group). Moreover, as in C, the decay kinetics of WT controls relative to G-Perm and G-Phos animals are similar. Data are expressed as a percentage of the mean baseline response over the 30 min before tetanus. Each response was the average of five individual waveforms.
