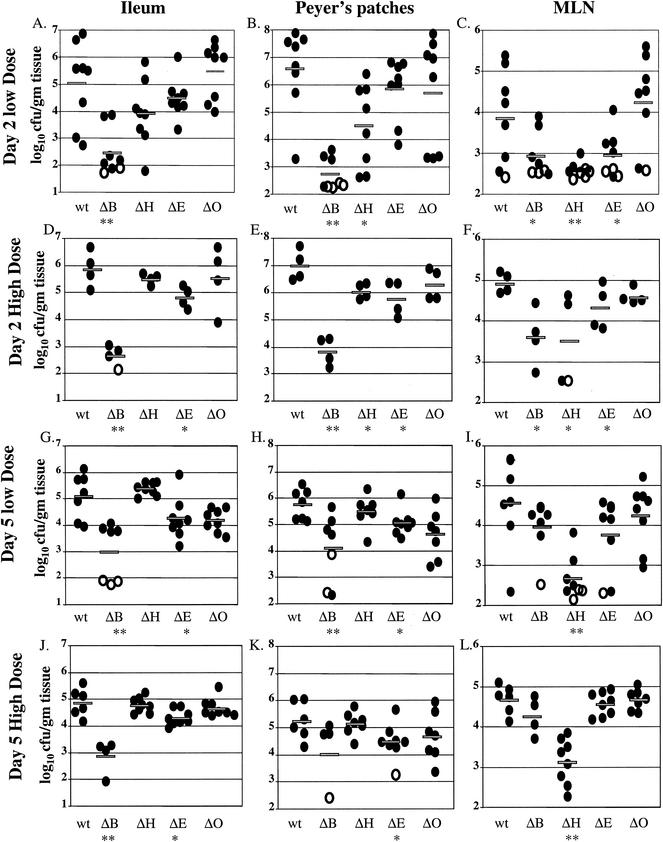
FIG. 2.
Colonization of ileum, PP, and MLN at day 2 and day 5 postinfection with either 2 × 10⁹ CFU or 2 × 10⁸ CFU of wild-type (wt), yopB (ΔB), yopH (ΔH), yopE (ΔE), or yopO (ΔO) Y. pseudotuberculosis. Data from four to eight mice from two to four experiments were pooled. Each symbol represents the log10 CFU/gram of tissue for the tissue sample from one mouse. Shaded bars represent the average log10 CFU/gram of tissue. Open symbols indicate that less than 10 CFU were recovered/tissue. Asterisks indicate statistical significance of difference between colonization levels of yop mutants and wild-type bacteria as follows: *, P = 0.1 to 0.01; **, P < 0.01.

