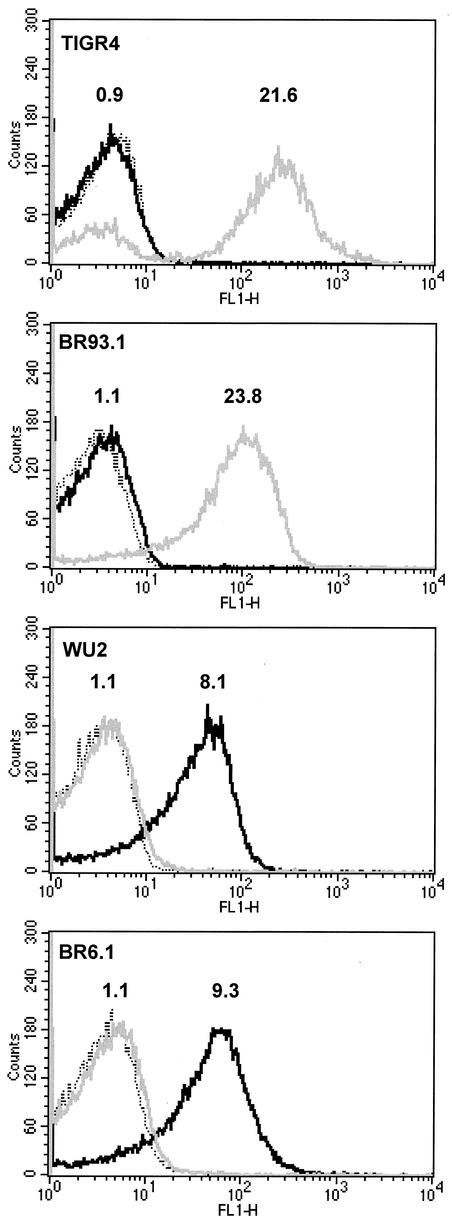
FIG. 2.
Flow cytometric analysis of PspA expression. S. pneumoniae TIGR4, BR93.1, WU2, and BR6.1 were treated with anti-PspA Xi126 or PC3.1 antibodies and counterstained with biotinylated anti-mouse antibodies and Alexa Fluor 488-conjugated streptavidin. Binding was quantitated by flow cytometry. Dotted trace, streptavidin-alone-treated bacteria; gray trace, binding of Xi126 antibodies; black trace, binding of PC3.1 antibodies. Numerals above the black and gray traces indicate the levels of binding as the fluorescent signal of the sample divided by the fluorescent signal of the streptavidin control. TIGR4 and BR93.1 (WU2 expressing PspA/TIGR4) showed no binding of Xi126 antibodies but showed strong and similar levels of binding of PC3.1, indicating that the strains expressed only PspA/TIGR4. WU2 and BR6.1 (TIGR4 expressing PspA/Rx1) showed no binding with PC3.1 antibodies but showed strong and similar levels of binding with Xi126, indicating that they expressed only family 1 PspA.

