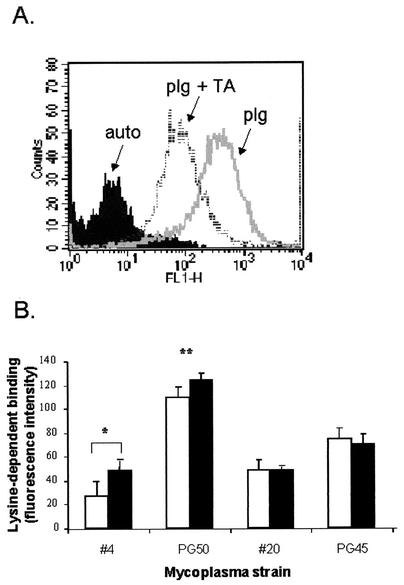
FIG. 1.
Cell surface FITC-plasminogen binding to mycoplasma strains. (A) Representative histogram plot of FITC-labeled human plasminogen binding to strain PG50, showing relative FITC fluorescence intensity (FLH-1) verses cell count. Autofluorescence relates to background levels of cellular fluorescence measured in the absence of FITC-plasminogen. The amount of lysine-dependent binding was measured as the difference between the geometric means of FITC-plasminogen (plg) and FITC-plasminogen plus TA (plg+TA). (B) Comparison of human (open bars) and bovine (filled bars) lysine-dependent FITC-plasminogen binding to four mycoplasmal strains. The concentrations of human FITC-plasminogen (50 μg/ml), TA (1 mM), and cells (5 × 10¹² cells/ml) remained constant for each assay. Bars indicate means ± standard errors of the means (n = 3). **, statistically significant difference between strain PG50 and strain 4 for both human and bovine plasminogen binding (P < 0.05). *, significant difference between human and bovine plasminogen binding in strain 4 only (P < 0.01).

