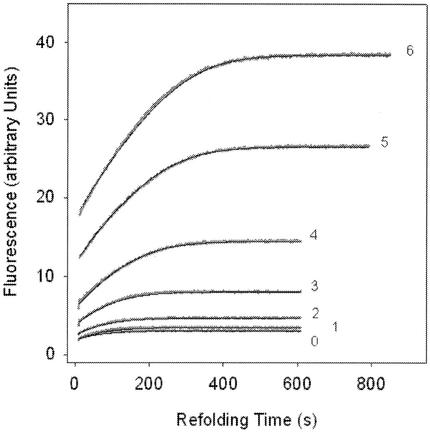
FIG. 4.
RCM-T1 refolding by Mip. The progress curves of refolding are shown for seven different concentrations of RCM-T1, 0.1 × 10⁻⁷ M (line 0), 0.21 × 10⁻⁷ M (line 1), 0.36 × 10⁻⁷ M (line 2), 0.43 × 10⁻⁷ M (line 3), 0.86 × 10⁻⁷ M (line 4), 1.72 × 10⁻⁷ M (line 5), and 3.44 × 10⁻⁷ M (line 6), in the presence of 13 nM L. pneumophila Mip protein. Measurements were performed in 0.1 M Tris-HCl-2 M NaCl (pH 8.0) at 15°C.

