
Figure 2.
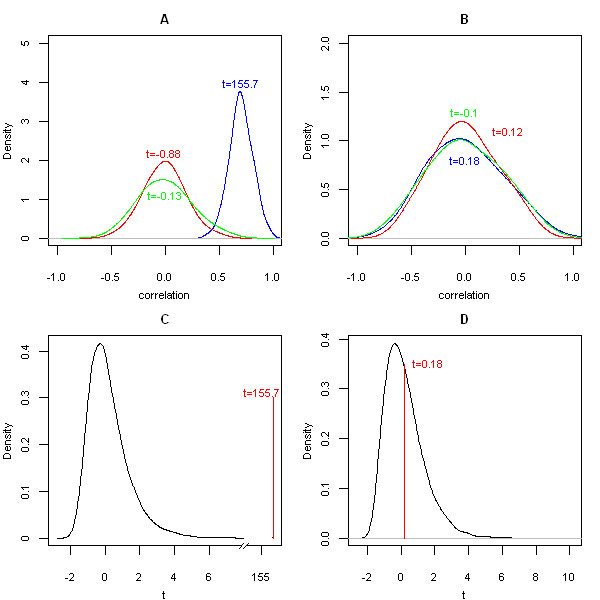
A differentially co-expressed group from the Golub dataset compared to random distributions. Group 3 (n = 34) from the Golub [21] data compared to random distributions. A) the distribution of pairwise correlation coefficients for group 3 in the ALL subset (blue) compared to the distribution of pairwise correlation coefficients from a group of the same size generated by the random uniform distribution (red) and the distribution of pairwise correlation coefficients from a group of the same size randomly selected from the dataset (green). B) Equivalent graph to A for the AML subset. C) A comparison of the observed t-statistic for group 3 in the ALL subset with a distribution of 10,000 random t-statistics generated by randomly resampling the dataset. D) Equivalent graph to C for the AML subset. Distributions were smoothed and drawn using density function in R [16]. Note that graph C has a broken x-axis.