
Figure 3.
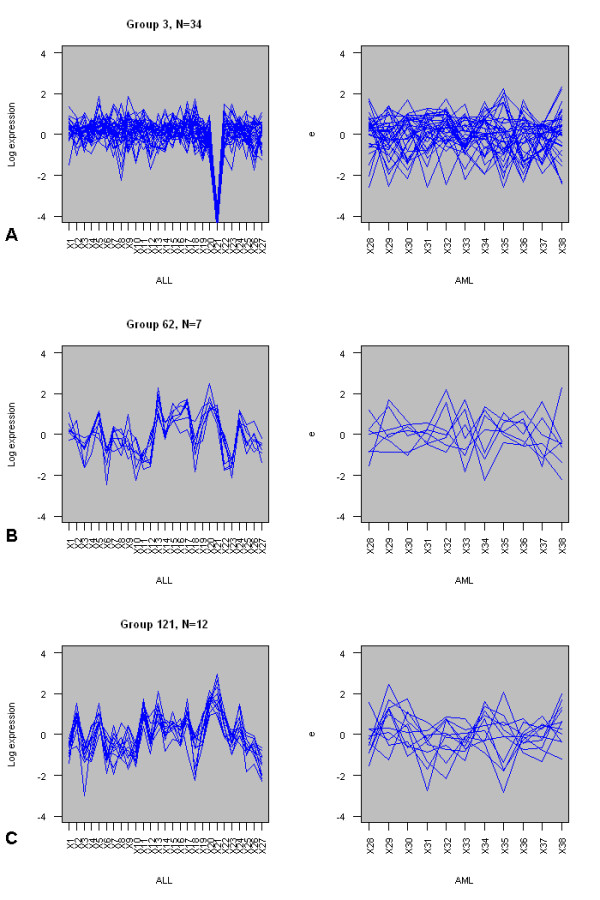
Expression profiles for three differentially co-expressed groups in the Golub dataset. Expression profiles for three groups of differentially co-expressed genes from the Golub dataset [21]. A) Group 3 (n = 34) in 27 ALL samples (left) and 11 AML samples (right). B) Group 62 (n = 7) in 27 ALL samples (left) and 11 AML samples (right). C) Group 121 (n = 12) in 27 ALL samples (left) and 11 AML samples (right). Expression levels have been scaled and centred.