
Figure 5.
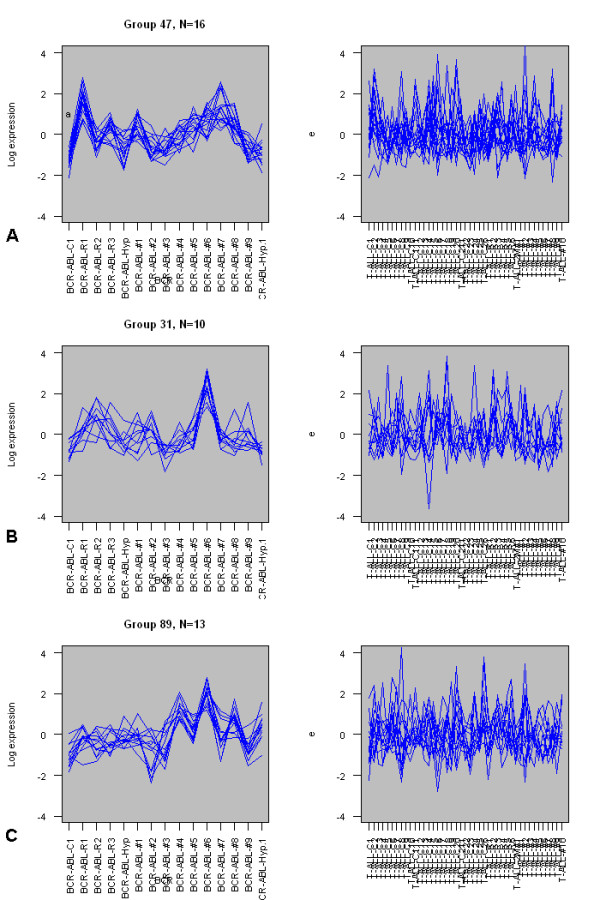
Expression profiles for three differentially co-expressed groups in the ALL subtype dataset. Expression profiles for three groups of differentially co-expressed genes from the Yeoh et al dataset [23]. A) Group 47 (n = 16) in 15 BCR-ABL samples (left) and 43 T-ALL1 samples (right). B) Group 31 (n = 10) in 15 BCR-ABL samples (left) and 43 T-ALL1 samples (right). C) Group 89 (n = 13) in 15 BCR-ABL samples (left) and 43 T-ALL1 samples (right). Expression levels have been scaled and centred.