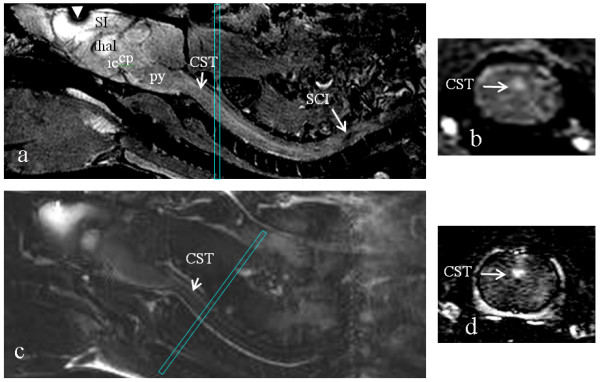
Figure 2.

In vivo visualization of the rat central nervous system and cross sectional views of the CST pathway in the sagittal and axial planes. This data were acquired using 3D GE-MEI (a and b) and IR-MEI (c and d). The arrow labeled "SCI" points to the lesion at the T4 level. Thin-rectangles overlaid on the sagittal images represent the slice orientation for the axial images. Arrowhead in a denotes the site of the Mn injection in the brain, where the signal hypointensity is due to the presence of high local concentration of Mn. SI – primary somatosensory cortex, ic – internal capsule, thal – thalamus, cp – cerebral peduncle and py – pyramidal tract.
