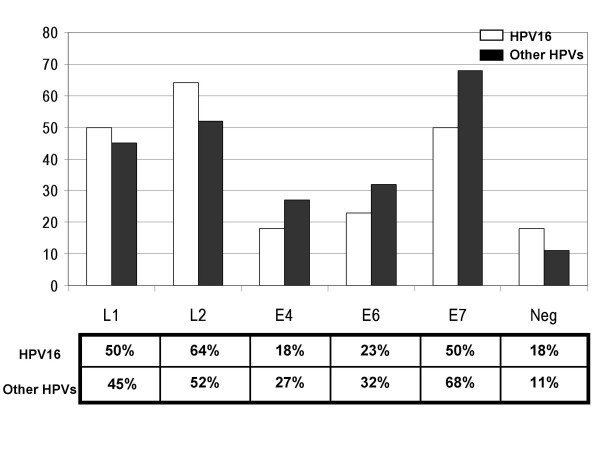
Figure 3.
Comparison of the percentages of sero-reactivity. The percentages of sera reacting to the HPV16 L1, L2, E4, E6 and E7 proteins are shown; the percentages of the HPV16 serum group are in white bars and those the other HPVs serum group are in black bars. The percentages of negative sera in the two groups (Neg) are also given.

