Figure 8.

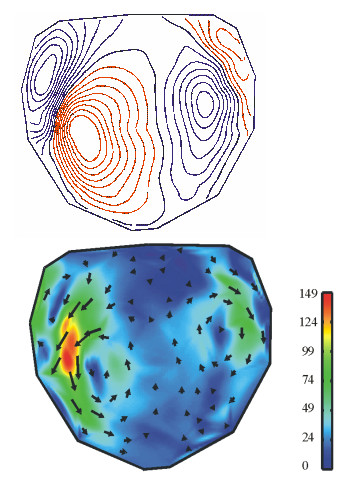
Top: Br-map of an acoustically stimulated (1 kHz) N100 signal (contour step 50fT), and bottom: its HC-transformation (scale in fT/cm).

Top: Br-map of an acoustically stimulated (1 kHz) N100 signal (contour step 50fT), and bottom: its HC-transformation (scale in fT/cm).