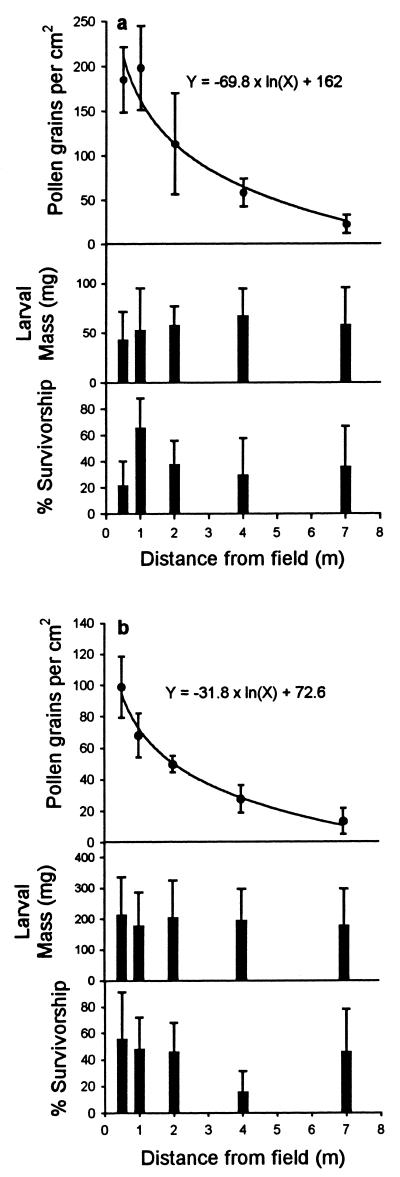
Figure 2.
Pollen loads, larval mass, and survivorship of early instar black swallowtails as a function of distance from the edge of field of Bt corn. (a) First array. Plotted data are the mean and SD of pollen counts associated with the five plants in each row. The regression was based on average total pollen counts at each distance from the edge of the field (F = 32.3, df = 1,3, P = 0.0108, r2 = 91.5). (b) Second array. The regression for pollen count as a function of distance from the field was based on averaged pollen counts at each distance (F = 285, df = 1,3, P = 0.0005, r2 = 98.9). Total pollen counts were based on the summed counts for the two sequentially placed traps in each pot.

