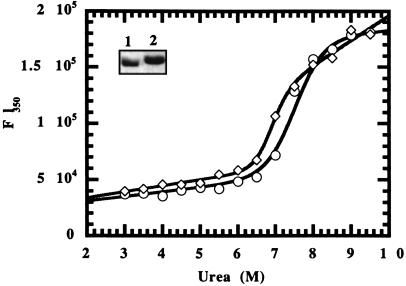
Figure 3.
Urea denaturation curves of FimH and dscFimH. Shown is a Coomassie blue-stained SDS/PAGE gel of purified FimH and dscFimH (inset lanes 1 and 2, respectively). FimH (circles) and dscFimH (diamonds) were incubated with increasing concentrations of urea + 4 mM DTT, and the change in fluorescence at 350 nm was measured to monitor denaturation.

