Figure 4.
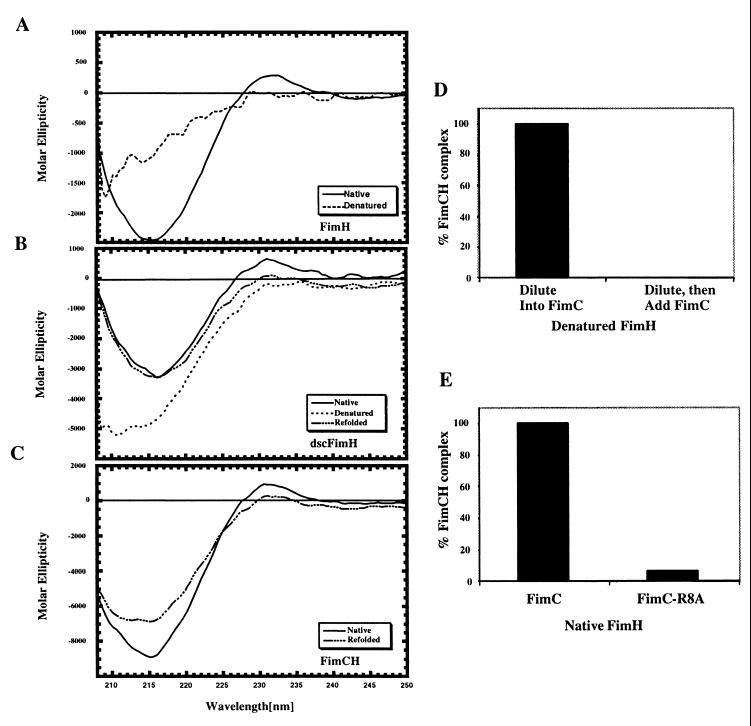
Refolding of dscFimH and FimH. The CD spectra were measured for native (solid line) and 9 M urea denatured (dashed line) FimH (A), dscFimH (B), and native FimCH (C). The CD spectra of denatured dscFimH after rapid dilution to 0.45 M urea (long and short dashed line) (B) and denatured FimH after rapid dilution to 0.45 M urea in the presence (long and short dashed line) (C) or absence of FimC (elicited no signal attributable to aggregation of FimH) were also determined. The ability of FimC to bind to denatured FimH that was subjected to rapid dilution was measured (D). FimC was either present in the diluent (left side) or added after dilution (right side). The ability of FimH separated from FimCH in 3 M urea to bind to FimC (left) or R8A FimC (right) when diluted to 0.45 M urea was measured (E).

