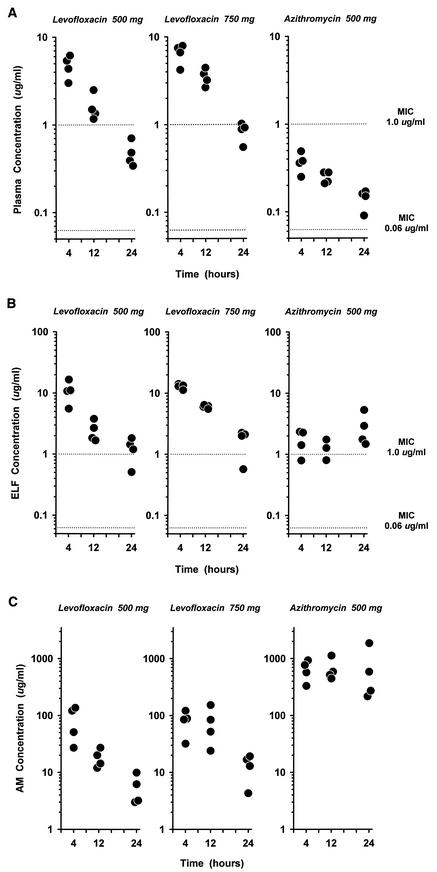
FIG.2.
(A to C) Individual steady-state concentrations of levofloxacin and azithromycin in plasma (A), ELF (B), and AM (C) at 4, 12, and 24 h after the start of the last antibiotic infusion. The y axis is in the log scale. In panels A and B, the dotted lines represent MICs (0.06 μg/ml applies to levofloxacin for H. influenzae and M. catarrhalis and to azithromycin for S. pneumoniae; 1.0 μg/ml applies to levofloxacin for S. pneumoniae and to azithromycin for H. influenzae).

