Figure 1.
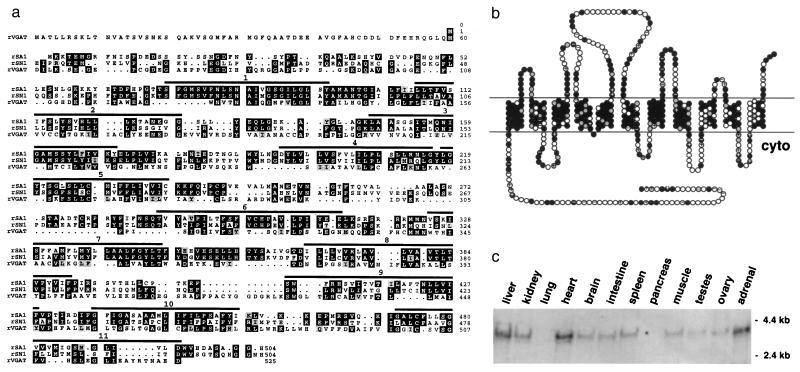
Sequence and tissue distribution of SA1. (a) The sequence of the rat cDNA predicts a protein (rSA1) with strong similarity to the rat System N transporter (rSN1) and weaker similarity to the rat vesicular GABA transporter (rVGAT). The bars indicate predicted transmembrane domains, and the numbers the amino acid position relative to the translation start. Black boxes indicate identical residues and gray conservative substitutions between rSA1 and rSN1. (b) Predicted transmembrane topology of SA1 with 11 transmembrane domains and a relatively large N-terminal cytoplasmic domain. Minus signs (−) indicate acidic residues, and plus signs (+) basic residues. Black circles indicate residues identical between rSA1 and rSN1 and gray conservative substitutions relative to rSN1. (c) Northern blot analysis with 3 μg of poly(A)+ RNA per lane shows expression of an ≈4.3-kb SA1 transcript in all tissues except the lung and pancreas.

