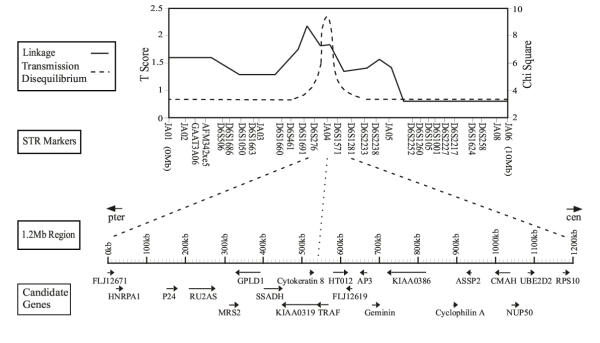
Figure 1.
Transmission disequilibrium and genetic linkage analyses of the 6p21.3 reading disability locus, regional STR markers and transcription map. At the top of the figure is the result of the DeFries-Fulker linkage (T Score, solid line), and QTDT linkage disequilibrium (chi-square, dashed line) [14]. The location and order of the 29 STRs are shown below which identify a peak of transmission disequilibrium at marker JA04. Below the markers is a detailed representation of 1.2 Mb surrounding marker JA04. The 19 genes and 2 pseudogenes encoded in this region are shown with the telomere on the left and centromere on the right and their position and direction of transcription indicated by the arrows.

