
Figure 5.
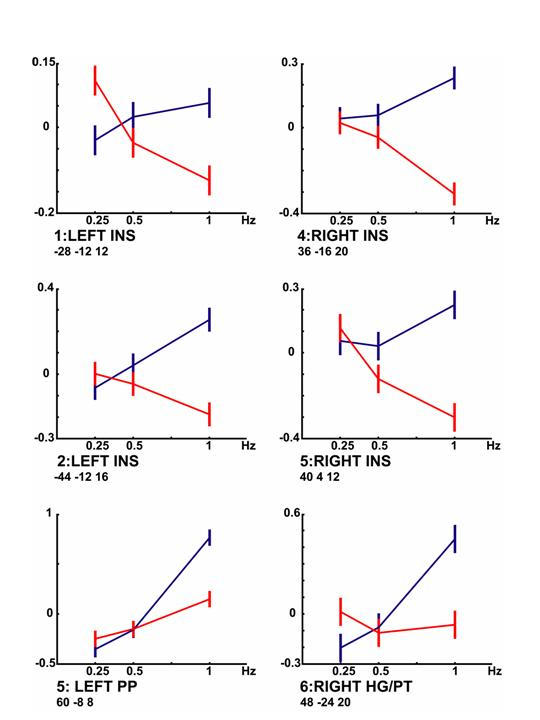
Bar graphs show interaction effect for local maxima within each activated cluster at increasing presentation rates (local maxima > 8 mm apart, see Table 3). Blue line indicates passive listening, red line semantic discrimination condition. X-axis: rate in Hz; y-axis: effect size (and standard error) in arbitrary units. Abbreviations: INS = posterior insula, HG = Heschl's Gyrus (primary auditory area), PP = planum polare, PT = Planum temporale.