
Figure 7.
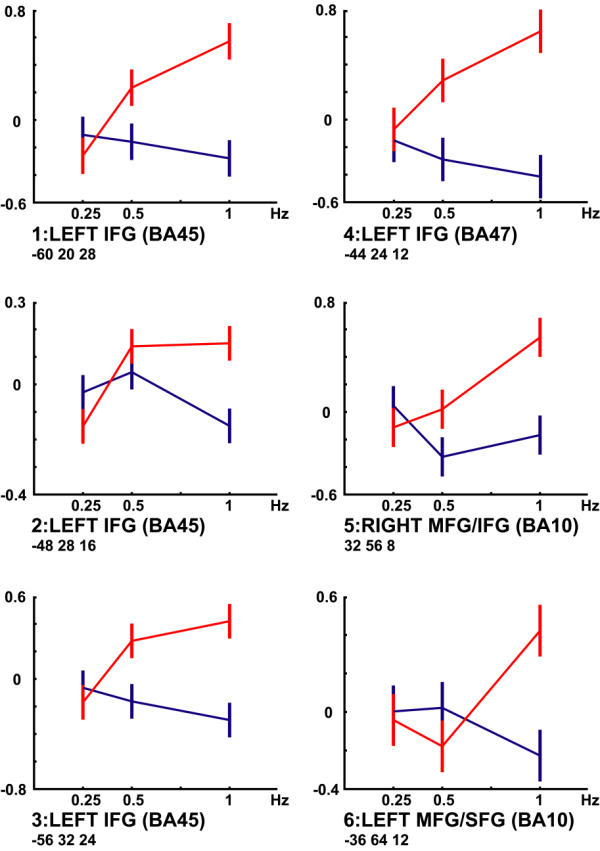
Bar graphs show interaction effect for local maxima within each activated cluster at increasing presentation rates (> 8 mm apart, see tab. 1). Blue line indicates passive listening, red line semantic categorization condition. x-axis: rate in Hz; y-axis: effect size (and standard error) in arbitrary units. Abbreviations: IFG = inferior frontal Gyrus.