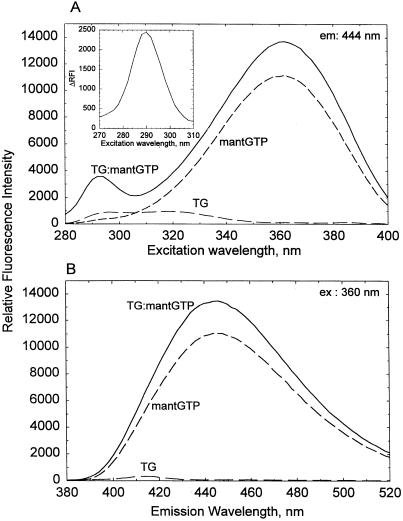
Figure 1.
Fluorescence spectra for mantGTP and TG. (A) Excitation with λ = 444-nm emission. (B) Emission with λ = 360-nm excitation. Recordings were made at 20°C with TG (1 μM) and mantGTP (0.5 μM) separately and with the two combined (solid line); the solutions (150 μl) also contained 10 mM sodium phosphate, pH 8/100 mM NaCl/0.5 μM MgCl2. (A Inset) An energy transfer band (λmax = 290 nm) calculated from the difference of excitation intensities between the mixtures of TG with mantGTP and the sum of TG and mantGTP alone.

