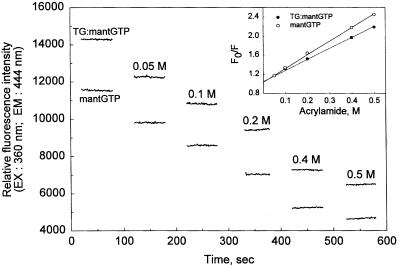
Figure 2.
Acrylamide quenching of fluorescence of the TG-bound and free mantGTP. Conditions for recording emission intensities (λ = 444 nm, at 360-nm excitation) were identical to those described in Fig. 1, except for the presence of varying concentrations of acrylamide (0.05–0.5 M, as indicated on the graph). (Inset) Fluorescence changes in the emission intensity (F) with increase of acrylamide concentration, relative to that in the absence of acrylamide: F0.

