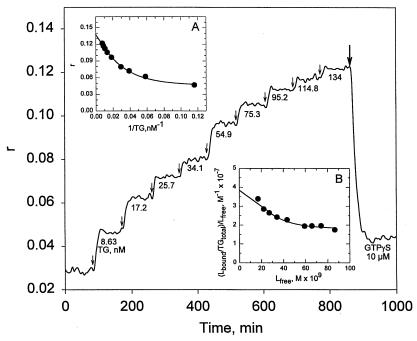
Figure 4.
Binding of mantGTP/Mg2+ to TG, examined by changes in fluorescence anisotropy. Conditions were the same as described in Fig. 3, except for the fact that the concentration of TG was increased stepwise. There was only a slight change in solution volume (from 1 to 1.066 ml) during the course of titration; times of addition of TG are indicated by the vertical arrows, and its concentrations are given as nM. At the end of the experiment (heavy vertical arrow), GTPγS (10 μM) was injected. (Inset A) A plot of the reciprocal of TG concentrations against r. (Inset B) A graph for calculating binding constant (40).

