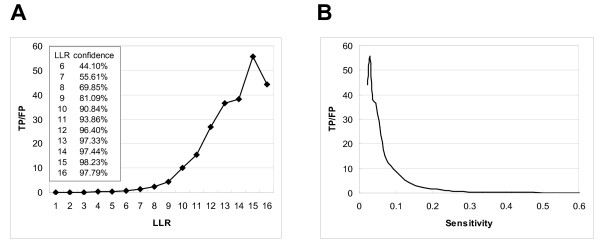
Figure 3.
TP/FP ratios (true positive versus false positive) at different LLR cutoffs or sensitivity by 10-fold cross-validation. The TP/FP ratios and the sensitivity (TP/(TP+FN)) are calculated for different LLR (log2LR) cutoffs. Each dot on the curves represents an average of ten cross-validations at a particular LLR cutoff. A. TP/FP ratios versus LLR cutoffs. A resolution of 44% false positives (TP/FP>1) corresponds to a LLR cutoff of 7.0 and 180,010 predicted interactions. Predicted interactions of higher confidence (larger TP/FP ratios) can be obtained by selecting LLR cutoffs higher than 7.0. B. TP/FP versus sensitivity. The TP/FP ratios indicate the accuracy at a certain resolution, while the sensitivity defines the ability of a test to detect true positives. Hence a tradeoff exists between accuracy and sensitivity of a prediction.

