
Figure 2.
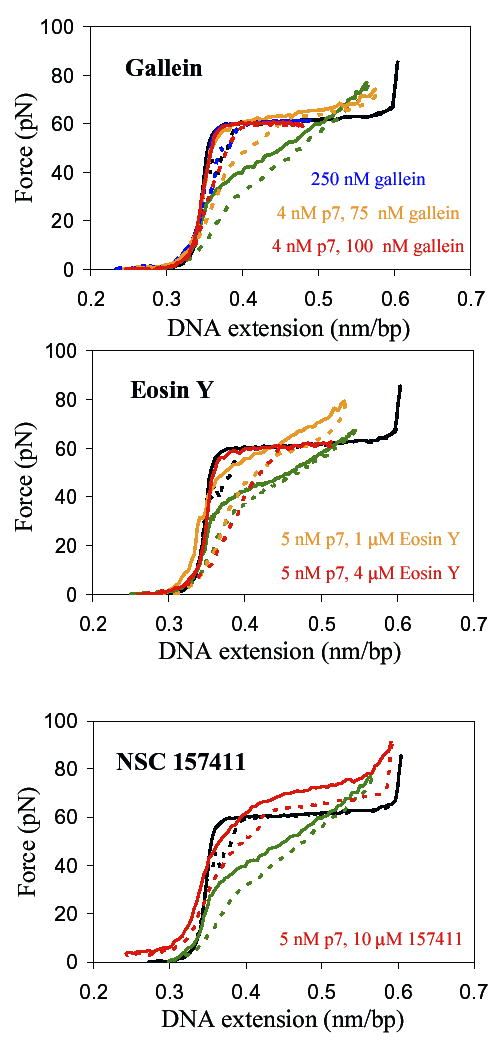
Typical results for single DNA molecule stretch-relax cycles in the absence or presence of HIV-1 NCp7 and some of the tested compounds. Solid lines are for stretching and dashed lines for relaxation. The black lines are for DNA only and the green lines are for DNA with 5 nM NCp7. The concentrations of NCp7 and/or compound are indicated in the legends. None of the compounds alone had any effect on DNA stretch-relax curves.