
Figure 6.
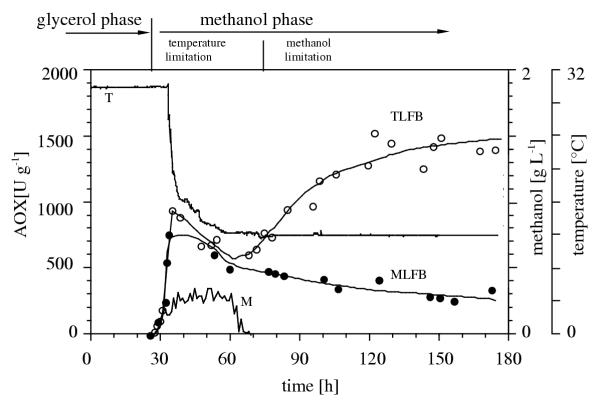
Comparison of the specific AOX activity in TLFB (open circles) and MLFB (closed circles) processes. The temperature (T) and methanol concentration (M) profiles of the TLFB process are also shown. During the methanol limitation phases, the methanol signal is close to zero and not visible in the figure.