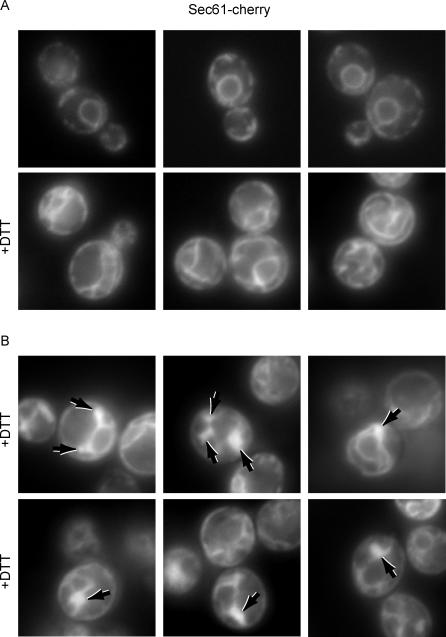
Figure 4. Fluorescence Visualization of an ER Marker after UPR Induction.
(A) Cells treated with the UPR-inducing drug DTT (+DTT) or with no drug were visualized using a fusion protein between the translocon component Sec61 and the red-fluorescent protein “cherry.” Top panels show untreated cells, and bottom panels show representative UPR-induced cells.
(B) Representative images showing UPR-induced cells that contain ERAs (indicated by arrows).

