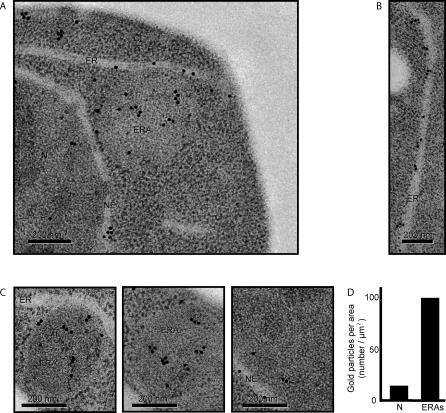
Figure 5. Immunogold Labeling of ERAs with an Antibody Directed against an ER Membrane Marker.
(A) Representative section of a cell immunolabeled against a myc-tagged Sec63, an integral ER membrane protein. As a primary antibody, we used a rabbit polyclonal anti-myc and, as a secondary, we used 15-nm gold particles–conjugated anti-rabbit antibody. Nucleus, nuclear envelope, ER, and ERA are indicated as N, NE, ER, and ERA, respectively.
(B) High magnification of an electron micrograph of a section of ER. Quantification showed that there are 5 ± 2 gold particles per linear micrometer of ER.
(C) High magnification of ERAs. To predict how many gold particles one should expect in a particular ERA, we first calculated and averaged the amount of ER (expressed as length in linear micrometers) present in an ERA (similar to the ones shown in Figure 3B), and normalized the value for its area. These calculations determined that there are 20.8 ± 3.3 μm of ER per μm2 inside the ERAs. These values allowed us to predict how many gold particles would be expected over a section of an ERA if it were packed with ER membranes. Two representative ERAs are shown. The ERA shown in the middle picture should hold 2.4 μm of ER inside and, therefore, should have 12 gold particles. We counted 12 gold particles. The ERA on the right could contain 2.7 μm of ER and should contain14 gold particles; we counted 16 gold particles. The image on the right shows a representative view of a nucleoplasmic region.
(D) Quantification of gold-labeling density per area. To assess the signal-to-noise ratio of our immunogold-labeling procedure, we assessed background labeling by counting the number of gold particles over an areas of nucleoplasm (N) and over ERAs, and normalized the counts to the respective areas.

