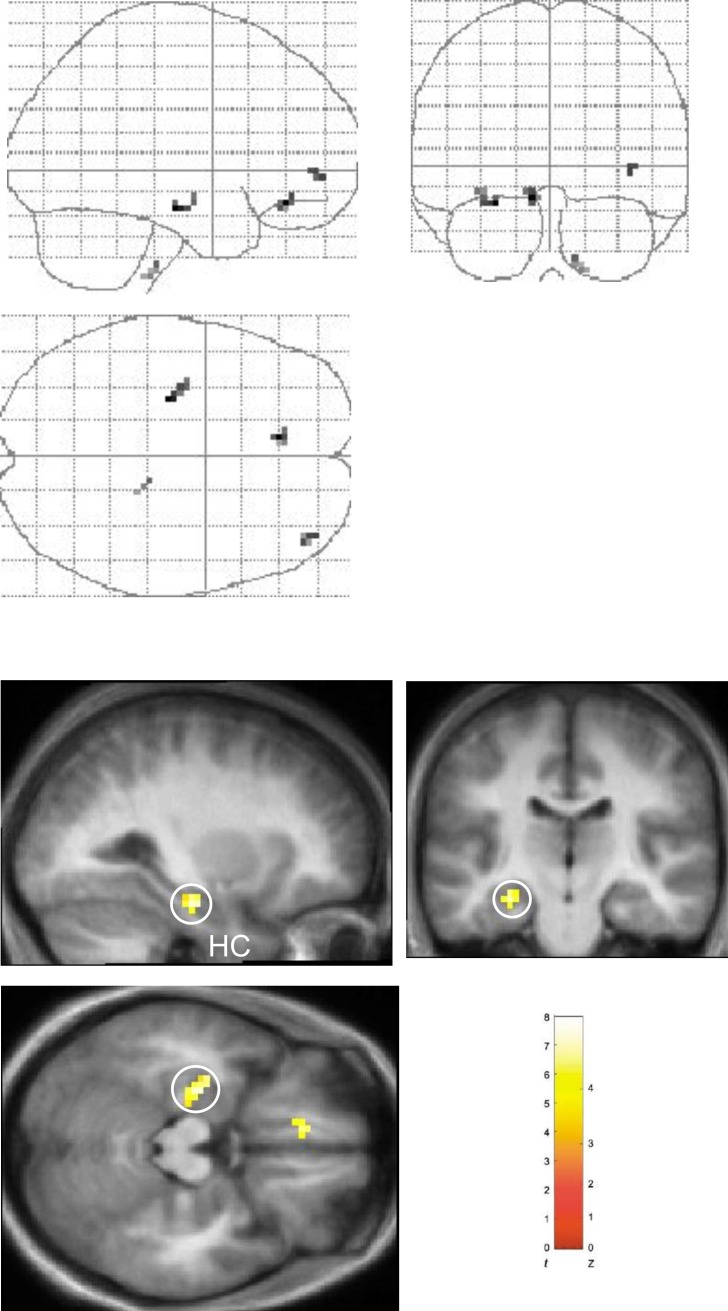
Figure 2. Main Effect of Sequence Type in Left Hippocampus: Shalf > Snew.
Results of comparison of Shalf and Snew conditions (Shalf > Snew, collapsed across object-context factor). “Glass brain” figures are displayed above. Activations shown on the averaged structural MRI scan of the 17 participants (displayed below). The color bar indicates the t-statistic associated with each voxel, and the Z-score equivalent. Activation in left hippocampus (HC) (x, y, z = −27, −18, −18; z = 3.59) is circled in sagittal, coronal, and axial planes. Activation in left medial prefrontal cortex (x, y, z = −9, 36, −15; z = 3.58) evident on axial section and significant at p < 0.001 uncorrected. Threshold is set at p < 0.005 uncorrected for display purposes.

