
Figure 3.
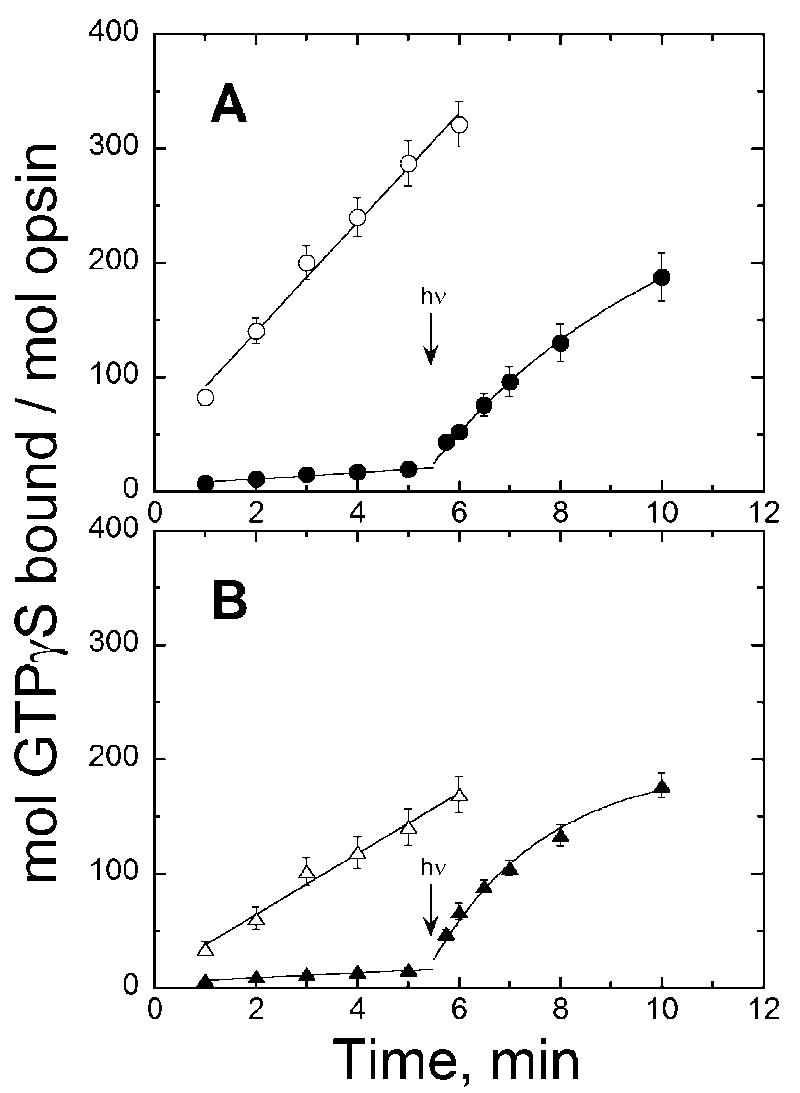
Transducin activation by (A) E108Q mutant and (B) wild-type salamander UV cone opsins (open symbols) and pigments (filled symbols). To the opsin sample, 1 μL ethanol was added; to the pigment sample, 1 μL 11-cis retinal in ethanol was added to a final concentration of 240 μM and incubated at least 1 h. Error bars reflect standard deviation of the means for both activity and opsin concentration.