
Figure 5.
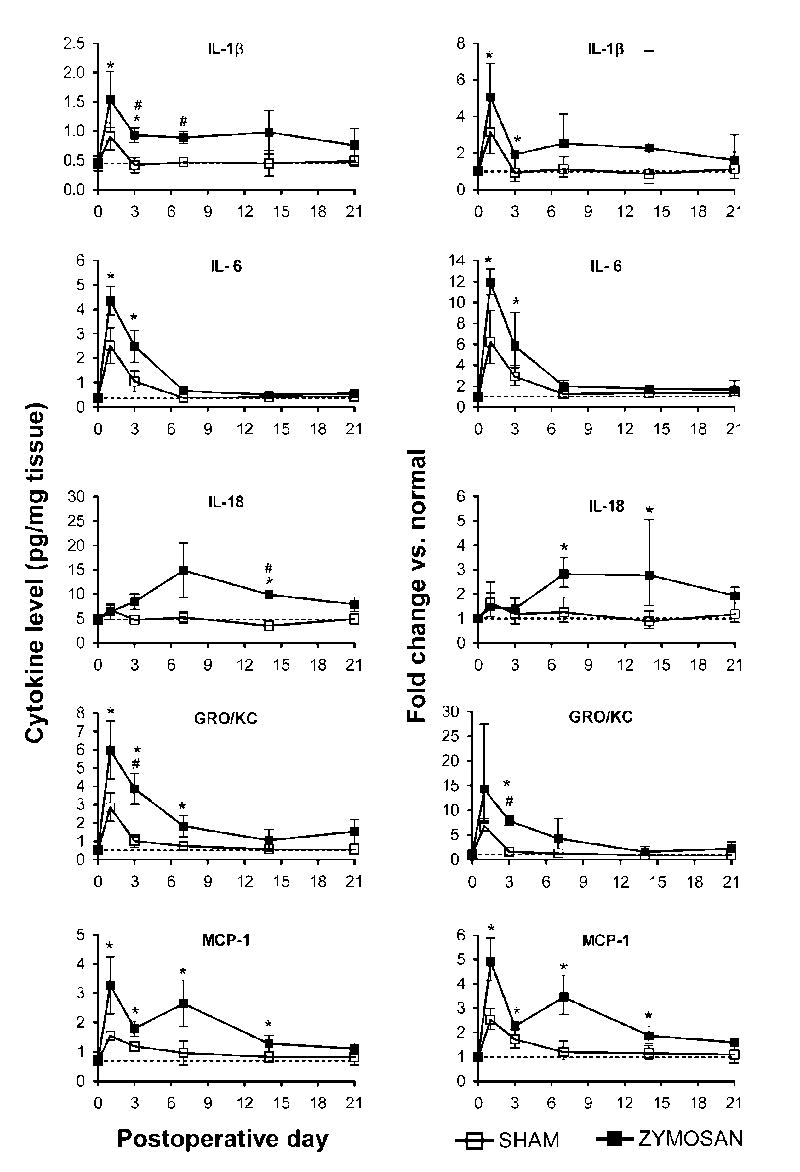
Selective up-regulation of cytokines in the inflamed DRGs. Time course of levels of the indicated cytokines is shown on the left; the normal values in unoperated rats are indicated by the dotted lines. Fractional changes (normal rat values used as the basis) are shown on the right. Zymosan dose was 10 μg.