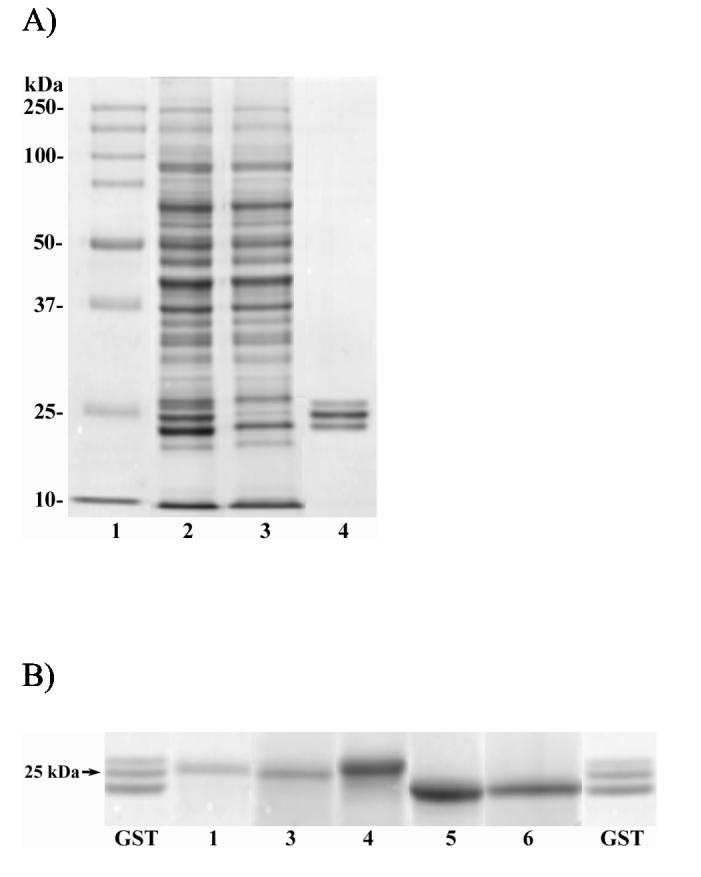
Figure 2.

SDS-PAGE analysis of rat liver cytosol and affinity-isolated GSTs. Panel A: lane 1, molecular standards; lane 2, unfractionated cytosol from PB-control rat liver; lane 3, flow through fraction from the GSH-Agarose column; lane 4, affinity purified GST. Panel B: lanes marked GST, affinity purified GST from rats treated with [14C]-BB prior to HPLC (same as lane 4 above); lanes numbered 1-6, HPLC peaks numbered 1-6, respectively, in Figure 1.
