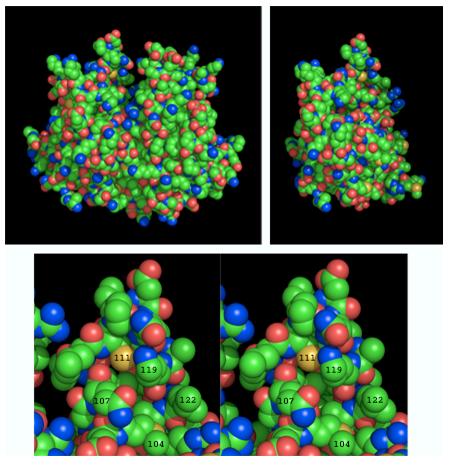
Figure 6.

Structures of GSTA1. Upper left: Space filling model of the homodimer (PDB 1F3A) showing the hydrophobic non-substrate ligand-binding groove at the top center of the molecule. The upper right structure was produced by removing the A-chain of the homodimer and rotating the structure slightly about its vertical axis to show better the location of Cys-111 (yellow sphere near the top of the molecule). Bottom panel: Stereo view of the environment around Cys-111 showing the nitrogen of Lys-119 poised immediately adjacent to the sulfur of Cys-111, which is at the back of a hydrophobic pocket created by the side chains of Leu-122, Met-104 and Gln-107. This figure was made using PyMol (http://pymol.sourceforge.net/). Color scheme: carbon, green; nitrogen, blue; oxygen, red; sulfur, yellow.
